Unbalanced Chart of Account Hierarchies
Unbalanced Chart of Account Hierarchies
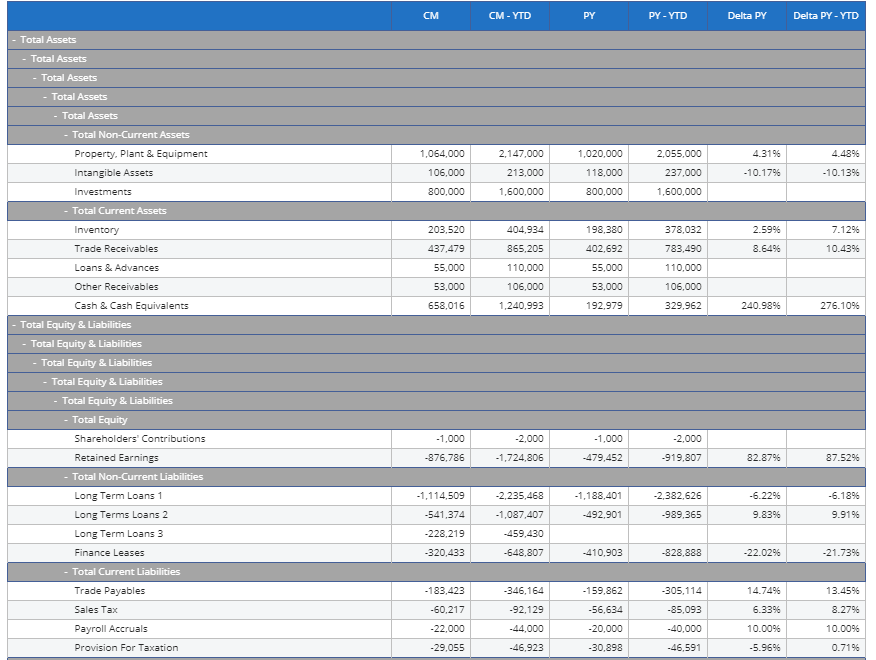
Most chart of accounts have various levels, in the example below you see that the accounts Property, Plants & Equipment, Intangible Assets and Investments are a child of Total Non Current Assets and Total Non Current Assets is a child of Total assets.
In this example there are 3 levels, but often you see that some groups have more levels and some groups have less levels, we call this an unbalanced hierarchy.

Unbalanced hierarchy.
If the account you want to import, is unbalanced then you need to repeat the same account ID and account description for the various levels.
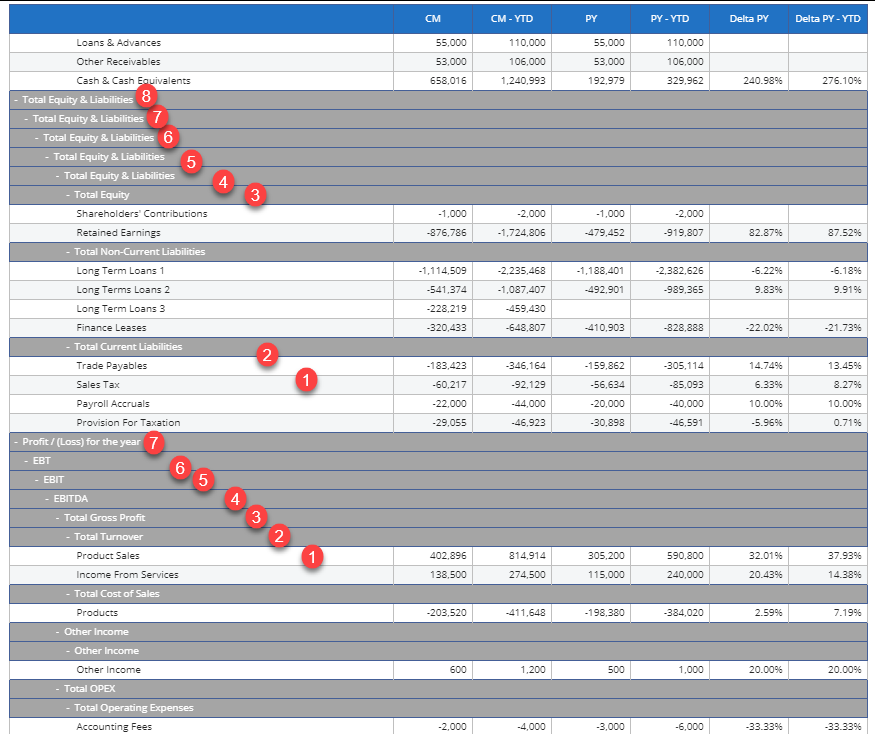
In the example below you see that the Profit and Loss is 7 levels deep, however the Balance is only 4 levels deep.
So your source table would look like this:
|
Level 6 |
Level 5 |
Level 4 |
Level 3 |
Level 2 |
Level 1 |
GL Account |
|
Total Equity and Liabilities |
Total Equity and Liabilities |
Total Equity and Liabilities |
Total Equity and Liabilities |
Total Equity and Liablities |
Total Equity |
Shareholders' Contribution |
|
Profit / Loss for the year |
EBT |
EBIT |
EBITDA |
Total Gross Profit |
Total Turnover |
Product Sales |
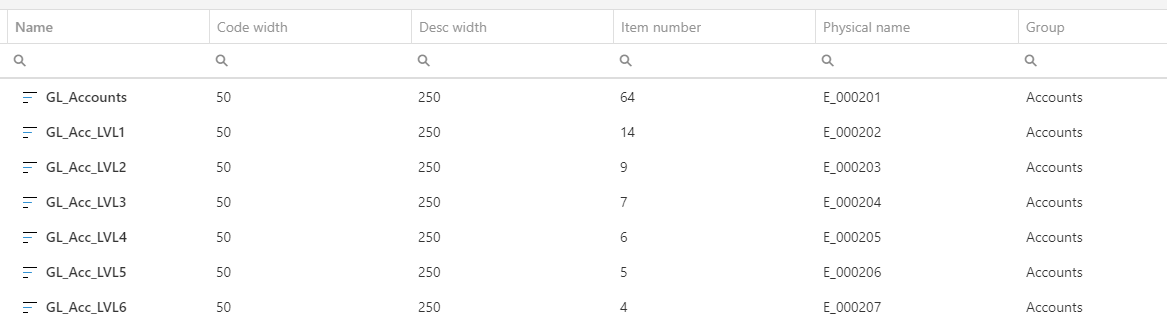
If you want to create this hierarchy then you need to look at the maximum number of levels, in this example 7 and you create entities for each level, the lowest level should always be the GL Account,
because on this level you want to import your data.
So the structure would look like this:
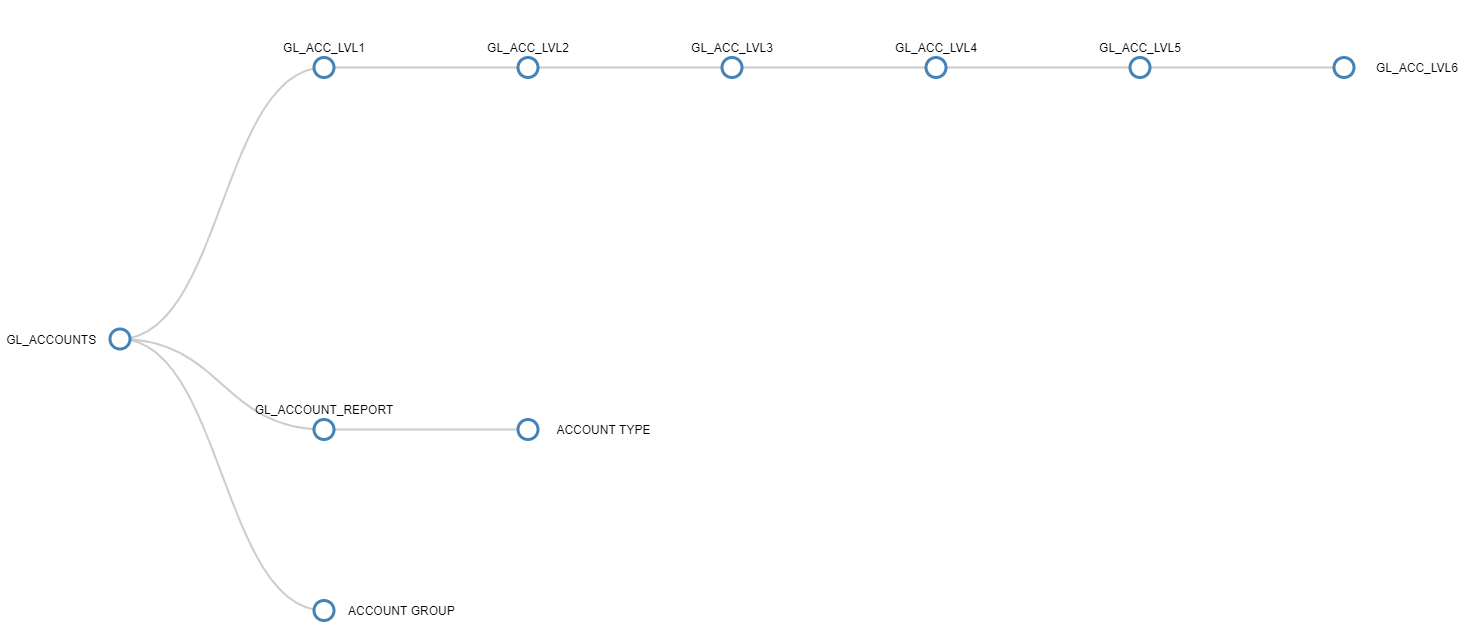
And the hierarchy (Relationship) would look like this:
So in your data view you select all levels, you will get an overview below, which doesn't look nice because there is a lot of unnecessary levels for some accounts.
Open you screen in design mode and select the data view, on the right there is the option Show groups as an unbalanced hierarchy.

And the result will look like this, I think you agree with me that this looks much better.
